


Car accidents are a scourge of American life, prematurely ending lives and upending families. Nobody wants to think about their lives being torn apart, but understanding the statistics helps us to make the roads safer for everybody.
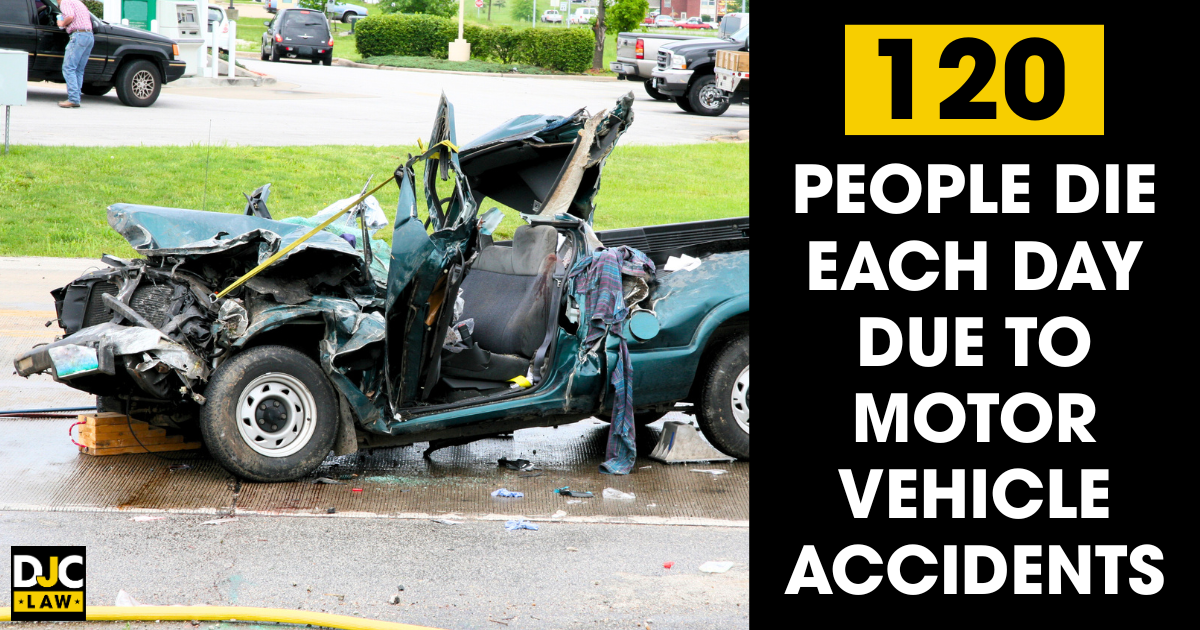
The U.S. Centers for Disease Control reports that 120 people die each day due to motor vehicle accidents. One is too many, but the truth is that the age we live in today is safer than any other, and the numbers play an important role in that.
In today’s article, we’ll sift through the statistics garnered from a range of government agencies, road safety organizations, and private companies to see what the state of play is on America’s roads today. If you or a loved one has experienced a collision, an Austin car accident lawyer can help you understand your rights and options.
Key Takeaways
- An estimated 40,000 fatalities occur each year in the U.S., with the overall trajectory gradually trending downward in the years after the COVID-19 pandemic.
- Speeding and drunk driving collectively represent over 60% of all fatal accidents nationwide.
- The leading contributors to car accidents include human error, poor road design, crumbling infrastructure, and weather conditions.
- Passenger vehicles are involved in the majority of fatal accidents, with SUVs and pickup trucks following close behind.
- The state with the most motor vehicle fatalities by pure numbers is California, followed by Florida and Texas. Adjusted for population, Mississippi is the most dangerous state in the country for driving.
- The safest states to drive in, adjusted for population, include Massachusetts, New Jersey, and Minnesota.
- Fatality rates show that summer is the most dangerous season to drive due to increased traffic volumes. However, holidays remain the most dangerous days of the year, with Independence Day, Memorial Day, and Thanksgiving being among the most hazardous.
- If you’ve been involved in an accident, contact a car accident lawyer to file your claim and ensure you’re not left out of pocket due to a negligent driver.
Key Insights: Understanding Car Accident Trends in 2025

Car accident deaths have remained stubbornly stable, with minor increases and decreases each year, but with a slight trend moving down. The National Highway Traffic Safety Administration (NHTSA) 2023 Fatality Analysis Reporting System and Crash Reporting Sampling System found that 42,721 people died in 2022, with early estimates for 2023 reporting a 4.3% decrease to 40,901.
The National Safety Council points out that although deaths are highest in the more populated states, with 4,428 in California in 2022, the death rate relative to population size paints a very different picture. Regardless of the model used, Massachusetts had the lowest death rate, while Mississippi had the highest.
Two leading causes stand out from all the rest, based on NHTSA statistics:
- Speeding – Speeding accounted for 29% of all deaths, accounting for 12,151 deaths and over 300,000 injuries.
- Drunk Driving – Closely behind is drunk driving, representing over 11,000 fatalities per year. In 2022, drunk driving surpassed speeding, with 13,524 deaths. On average, this is one death every 39 minutes.
Despite these damning statistics, Americans are becoming more conscious of road safety. The U.S. Department of Transportation reported record-breaking numbers of people wearing seat belts, with a rate of 91.6% of adult front seat passengers wearing them.
Evaluating the Overall Landscape of Car Accidents
Regarding public safety, traffic accidents are one of the most stubborn threats wherever you are in the country. Millions are injured every year, with even more bearing the scars of seeing family and friends go through the trauma of an accident.
Despite persistent safety campaigns and more technology to make modern vehicles safer, this is countered by the fact that more vehicles are on the road than ever before. Aging infrastructure is struggling to manage the influx, and that’s why the NHTSA still reports more than six million accidents annually.
Road safety experts typically point to the following as the biggest factors impacting high accident rates:
- Poor driver behavior
- Larger vehicles mixed in with pedestrians and cyclists
- Older infrastructure
- Poorly designed roadways
- Lax enforcement in some jurisdictions
Unfortunately, the U.S. is a notorious laggard on the world stage. The National Safety Council studied motor vehicle deaths from 2015 to 2019 and found that the U.S. saw an increase in deaths of 2.5%. In contrast, 15 other developed nations in North America, Europe, and beyond saw decreases.
While cars are safer than at any point in human history, other challenges, ranging from drivers to infrastructure, continue to end too many lives prematurely.
Comparative Analysis: 2025 vs. Previous Years
In early 2025, the latest data available is the NHTSA’s preliminary estimates for 2024. So far, the NHTSA predicts that there were 39,345 deaths in 2024, which would be a 3.8% decrease from 2023’s figures. If these predictions are proven to be true, it would be the first time that car accident fatalities have dropped below 40,000 since 2020.
The Insurance Journal also reports that the NHTSA’s initial predictions estimate that the fatality rate per 100 million miles traveled fell to 1.20, the lowest since 2019. It also represents a success because Americans are driving more miles, with a 1% increase in 2024.
Interestingly, 2024’s statistics indicate that for the first two quarters, deaths fell by 3.2% year-on-year. This marks the ninth consecutive period where fatalities have fallen, showing that although death rates are relatively stubborn, highway safety initiatives are having an impact.
On a side note, if we compare the figures from 1937, where 30.8 deaths per 100,000 people were reported, the current rate is 13.8, which is a 55% improvement.
Fatalities and Injuries: The Human Cost of Car Accidents
The tragedy of car accidents is the human cost, and what that means for individual families. One death is too many, and the human cost is something that’s often lost with high-level statistics. NHTSA data shows that over 39,000 people died in 2024, with one in five fatalities being pedestrians or cyclists.
Despite fatalities capturing the headlines, injuries are often just as problematic because they’re so often life-changing. According to the CDC, 2.1 million people visit emergency rooms every year because of car crash injuries.
Injuries like spinal cord damage, crushed limbs, disfigurement, chronic pain disorders, and Traumatic Brain Injuries (TBIs) transform lives forever, but mental trauma like anxiety, depression, and Post-Traumatic Stress Disorder (PTSD) can be equally as devastating.
It all adds up to an enormous economic cost, with the American Traffic Safety Services Association (ATSSA) estimating that serious car accidents add up to $460 billion in direct economic costs and $1.4 trillion in quality of life costs.
Injury Rates: What the Data Shows
Car accidents continue to be one of the most significant causes of unintentional injury in the country, with the NHTSA estimating that there were nearly six million injury-only motor vehicle crashes. However, the National Safety Council found that there were just 5.2 million medically consulted injuries, illustrating that hundreds of thousands of accident victims never sought medical attention.

Based on the NHTSA statistics broken down for 2022 (the most recent year for granular data), here’s how we can split the injured:
- 91% were passenger vehicle occupants
- 3% were motorcyclists
- 5% were nonoccupants, including pedestrians
Interestingly, while 28% of all accidents involved injuries and 71% were classified as property damage only, just 1% resulted in at least one fatality.
Demographics of Accident Victims: Age, Gender, and Location
The World Health Organization (WHO) reports that auto collisions are the leading cause of death worldwide for young people aged 5-29.
Teen drivers are also the most vulnerable road users, so they pay the highest auto insurance premiums. The Insurance Institute for Highway Safety (IIHS) reported 2,898 teen car crash fatalities in 2022, a 7% year-on-year decrease. Interestingly, if we look at the 42,514, the last year with available granular data, young drivers were involved in 13% of these incidents, despite making up just 5% of all licensed drivers.
Males are consistently more likely to die in car accidents than females. The IIHS reports that nearly every year, from 1975, saw two males dying in auto accidents for every one female. Of course, context matters. Males drive more miles than women and are naturally more inclined to riskier behaviors, such as speeding and drunk driving.
Despite this, car crashes rank fairly similarly for male and female drivers, with the leading cause of death for females and the second for males, just behind homicide/suicide.
Intriguingly, there’s not much difference between where these accidents happen. AutoInsurance.com reported that 59% of accidents occurred in urban areas, with 41% in rural areas.
Major Contributing Factors to Car Accidents in 2025
Examining the patterns and trends in the data shows that certain accident causes crop up again and again. Speeding and intoxicated driving are the leading causes of car accidents, but reckless driving behaviors, distracted driving, and even poor weather conditions are frequently mentioned in accident reports.
Let’s take a look at these major contributing factors using data gathered chiefly from the NHTSA.
The Role of Distracted Driving
Distracted driving is akin to driving blind. Anything that takes your attention away from the road falls into this category, with it making up 8% of fatal crashes in 2022. The CDC estimates that nine people are killed by a distracted driver every day.
Currently, the states with the highest car accident rates involving distracted drivers are New Mexico, Louisiana, and Kansas.
Impact of Impaired Driving on Safety
Impaired driving is one of the biggest problems on the road today, with drunk driving accidents resulting in 37 deaths every day. In 2022, 13,524 people lost their lives in traffic crashes involving a drunk driver. To put it into context, around one-third of deaths involve drunk driving.
If we compare individual states, South Carolina is the leading state in this category, followed by Rhode Island and Texas. Yet there’s nothing to choose between these three states, with all of them reporting that 42-43% of their crash deaths involved a drunk driver.
Speeding and Reckless Driving Trends
Speeding is incredibly common and is easily the most common traffic violation wherever you are. In 2022, 12,151 deaths were attributed to speeding, which totals 29% of all traffic fatalities.
It should come as no surprise that 83% of speeding drivers in fatal crashes were men. And a third of this group were men aged between 25 and 34. Despite stereotypes, seniors 75 and up were the least likely to speed.
It’s also important to mention that speeding is often paired with reckless and careless driving. The Pew Research Center found that just 4.9% of drivers in fatal crashes were charged, a share that’s barely moved since the organization started collecting these stats in 2010.
Weather-Related Accidents: An In-Depth Look
Weather conditions also pose an issue, especially in states known for extreme conditions. Over the last five years, the National Safety Council recorded a 20% increase in weather-related deaths and a 120% increase in injuries. Despite this, the number of recorded weather events increased by just 11%.
Other factors make the situation even worse, but speeding is the leading compounding agent. Here are some stats about how the weather changes the face of speeding-related fatalities:
- 44% involved mud, dirt, or gravel
- 41% involved frost or ice
- 39% involved moving/standing water
- 33% involved snow and slush
That’s why it’s no surprise that fatalities tend to be worse around the holiday season when deadly crashes spike.
Regional Variations in Car Accident Statistics
Car accidents and fatalities aren’t uniform across the country. The NHTSA splits the country into ten distinct regions, not into states. It should come as no surprise that the northeast, with its better public transit systems, does better than the southern states, where more people drive, there are more rural roads, and enforcement is poor.
Despite this, we already know that 59% of accidents occur in urban locations and 41% in rural areas, indicating that it’s not purely an urban vs. rural issue. Let’s dig into how the states fare in comparison.
States With the Highest and Lowest Accident Rates
Comparing the states means using a measure that accounts for population. By far, the states with the most deaths in terms of pure numbers are California, Florida, and Texas. And it isn’t even close because they’re the top three largest states by population.
That doesn’t mean California, Florida, and Texas are the most dangerous states statistically. Instead, we’ll use the measure of fatality rate per 100 million vehicle miles traveled.
So, what are the top five most dangerous states by this metric, based on NHTSA statistics from 2023?
- Mississippi – 1.73
- South Carolina – 1.70
- Arizona – 1.69
- Kentucky – 1.65
- West Virginia – 1.64
In contrast, here are the safest states when using the metric of fatalities per 100 million vehicle miles traveled:
- Massachusetts – 0.56
- Minnesota – 0.71
- New Jersey – 0.78
- Utah – 0.80
- Wisconsin – 0.87
But what of the top states in pure numbers? Here’s how they fare in terms of fatality rates:
- California – 1.26
- Florida – 1.47
- Texas – 1.41
Seasonal Trends: When Are Accidents Most Likely to Occur?
The wintertime isn’t the most dangerous time for accidents across the country, as many people think. Although states with notoriously bad winter weather see increased accidents, much of the country doesn’t experience the same extreme weather. According to the Insurance Information Institute, July and August are actually the worst months for accidents.
Summer and early fall are hotspots for accidents because more Americans are on the roads. Children are out of school, and families head off on vacation. There’s also the mass migration as students ply the nation’s highways on their way to college.
So, why isn’t winter the worst period for accidents? The truth is that Americans are more likely to drive more cautiously because they’re aware of the added risk. Plus, due to the weather, the number of miles driven drops, reducing the chances of an accident happening.
Crashes By Time of Day and Day of the Week
The changing of the seasons also causes peak crash periods to change. The National Safety Council found that in 2023, fatal car accidents were more common on weekends, with Saturday being the most dangerous day of the week.
Furthermore, due to the influence of rush hour, the number of nonfatal crashes tended to increase during weekdays. Nonfatal crashes peaked on Friday. In terms of times, fatal and nonfatal accidents peaked from 4 pm to 7:59 pm.
However, if we break this down into the seasons, here are the National Safety Council’s findings:
- Spring and summer see fatal crashes peaking between 8 pm and 11:59 pm.
- Nonfatal crashes peak earlier in the summer, from 12:00 pm to 4 pm.
- Late fall and early winter see fatal crashes peaking from 4 pm to 7:59 pm.
The Impact of Holidays on Accident Rates
Holidays are notorious for their increase in the number of accidents, both fatal and nonfatal. ValuePenguin’s analysis found that driving on the holidays is 13.9% dangerous than driving on any other day.
Holidays are an annual tradition, and so is the increase in accidents, due to more travel, alcohol consumption, and night driving. So, what are the most dangerous holidays, ranked by fatal crash volume based on 2023 figures?
- Independence Day (4th of July) – 450+ fatal crashes
- Memorial Day Weekend – 400+ deaths
- Thanksgiving – 400+ deaths
- Labor Day Weekend – 375+ deaths
New Year’s Day is another holiday known for its problems, and that’s because 40% of all crashes on this day involve impaired drivers. The one holiday that bucks the trend is Christmas Day because of the dramatic drop in drivers on the road.
Evaluating Accident Statistics by Vehicle Type
Certain vehicles are also more likely to be involved in fatal accidents than others. Most accident victims are from passenger cars because of the sheer volume of this vehicle type, but SUVs and pickup trucks are the next biggest offenders.
We looked at NHTSA statistics from 2013 to 2022, which is the most recent 10-year time period with this data, including 526,135 vehicles in 344,451 fatal crashes. Overall, the total number of vehicles in fatal collisions increased by 34.1%, despite the number of licensed drivers increasing by just 11%.
Here’s what we found about vehicle types and their relation to the most serious accidents.
Analysis of Vehicle Types Most Involved in Accidents
Here’s a table evaluating the results of this 10-year study by vehicle type in fatal accidents:
| Vehicle Type | Total Fatal Crashes | 10-Year Change |
|---|---|---|
| Passenger Cars | 198,976 | +11.7% |
| SUVs | 96,982 | +106.6% |
| Pickup Trucks | 87,621 | +22.4% |
| Motorcycles | 54,219 | +32.5% |
| Large Trucks | 47,445 | +48.9% |
| Light Trucks (Vans) | 21,228 | −3.8% |
| Buses | 2,305 | −24.5% |
Preventative Measures: Reducing the Risk of Car Accidents
Reducing car accidents means a concerted effort from the public, regulatory agencies, auto manufacturers, and lawmakers. It means improving personal responsibility, enforcement, and education through preventive measures that make a difference for everybody.
Work is already being done to tackle America’s car crash problem. Here are some of the areas the nation is focusing on.
Understanding Traffic Laws and Safety Regulations
Traffic laws are the foundation of keeping everybody safe, but a surprising number of drivers are unaware of the law. Part of the problem is the total lack of consistency between states, including on right-of-way rules, seat belt laws, and speed limits.
Many states are also working on tightening laws and making them stricter, such as lowering permitted Blood Alcohol Concentration (BAC) limits and strengthening Graduated Driver Licensing (GDL) laws for new drivers.
Public Awareness Campaigns and Their Effectiveness
Targeted public awareness campaigns and enforcement blitzes are also a common feature of federal and state governments. Bringing together focused law enforcement and media publicity is designed to both increase awareness of safe driving practices and boost law enforcement and compliance.
Examples of some of the more prominent public awareness campaigns include:
- Click It or Ticket
- Drive Sober or Get Pulled Over
- U Drive. U Text. U Pay
It’s a fact that combining awareness with enforcement increases compliance and reduces the rates of the more prominent accident risk factors, such as texting while driving, drink driving, and seat belt use.
Technological Advancements in Vehicle Safety Features
Auto manufacturers also have a role to play in making cars safer. Vehicles have never been safer, with an array of state-of-the-art safety features that reduce the prevalence and severity of accidents.
So, what are some of the technological advancements that are changing how people drive?
- Forward Collision Warning (FCW)
- Lane Keeping Assist (LKA)
- Adaptive Cruise Control
- Rear Cross-Traffic Alerts
- Automatic Emergency Braking (AEB)
- Blind Spot Monitoring
- Lane Departure Warning (LDW)
These advancements have had a measurable impact on crash rates. The IIHS discovered that vehicles with AEB reduce rear-end collisions by 27%. Additionally, vehicles equipped with LDW saw a reduction in lane drift collisions of 11%.
Federal mandates on new vehicles are making many of these features mandatory. Road safety experts agree universally that these will play a substantial role in cutting crash rates in the decade ahead.
Post-Accident Protocol: What to Do After a Car Accident
Knowing what to do after a car accident protects your health and any future legal claims. Every driver should know what to do after any type of accident, including seeking medical attention, gathering evidence, and notifying their insurer.
Follow these steps after your accident:
- Check yourself for injuries and call an ambulance if anyone is seriously hurt.
- Get to safety to avoid the risk of secondary collisions.
- Call 911 and ask for a traffic officer to attend.
- Exchange your contact and insurance details with the other driver, which you’re required to do by law.
- Gather evidence from the scene for your future auto insurance claim or personal injury lawsuit with your smartphone. Focus on visible injuries, vehicular damage, property damage, road conditions, and signage.
- Once you’re clear to leave the accident scene, head to the emergency room for a medical examination. This ensures that you don’t have any hidden injuries.
- Notify your insurer within 24-72 hours, as you must do according to your policy’s terms and conditions.
The final step is to contact an experienced personal injury lawyer to discuss what to do next. Lawyering up guarantees that your legal rights remain protected and gives you the best possible chance of a successful claim.
The Importance of Legal Representation and Insurance Claims
Auto insurance companies are there to protect their bottom lines, not to protect you. Legal representation holds insurers to account, ensuring that you squeeze out every last penny you’re entitled to.
An experienced car accident attorney makes a difference of tens of thousands of dollars, especially in cases with severe injuries, multiple vehicles involved, disputed liability, and underinsured or uninsured drivers.
Here’s how a personal injury attorney supports you during your personal injury claim:
- Defends your legal rights.
- Gather evidence and preserve it.
- Puts the evidence together to build a strong case.
- Calculates your damages.
- Deals with all communications.
- Files your personal injury claim and provides courtroom representation.
Even in relatively minor accidents, a lawyer could be the difference between a successful claim and a denied one.
Looking Ahead: Future Trends in Car Accident Statistics
Car accident statistics appear to be declining at a glacial pace, with the U.S. still lagging behind practically every other developed nation. However, efforts are being made, and technology and legislative changes have the potential to transform the picture in the years to come.
So, what can we expect in the future, and what might this mean for motor vehicle accident statistics years from now?
Emerging Technologies and Their Potential Impact
Vehicle technology is altering the risk profile associated with driving. Advanced driver assistance and autonomous vehicles are game changers in accident prevention.
For example, Advanced Driver Assistance Systems (ADAS), including AEB and LDW, are helping to reduce human error. Likewise, this can be paired with telematics to use data to detect risky behaviors and determine areas of improvement.
But technology is going even further. Autonomous vehicles are regularly making headlines. Once they become a prominent part of American car culture, we should see human error collapse, and human error is associated with 90% of all accidents.
The Internet of Things has been associated with so many changes in society, and Vehicle-to-Everything (V2X) communication could be the next evolution in this. In short, vehicles will be able to talk to traffic signals, infrastructure, and other cars to help improve traffic flow and reduce collisions.
Potential Legislative Changes and Safety Initiatives
Technology helps, but it can’t be a replacement for legislation. Federal and state bodies will be pivotal in setting laws that shape road safety going forward.
Examples include the Infrastructure Investment and Jobs Act, which provides additional funding to road safety programs. It’s also the same legislation that mandates AEB systems on all new vehicles by 2029.
We’re also seeing states improve enforcement of existing laws and make existing driving regulations even stricter, especially in relation to issues like distracted driving. Vision Zero plans, which aim to reduce traffic deaths to zero, are also greasing the wheels and giving lawmakers a sense of urgency.
Of course, none of this matters if it isn’t paired with more visible enforcement. With technological enforcement measures, like red light cameras, we should see more cities replacing traditional traffic stops in favor of automated enforcement measures.
Final Thoughts on Car Accident Statistics in 2025
It’s clear that America still has a substantial amount of work to do to make the roads safer for everybody. With growing challenges like aging infrastructure and more licensed drivers, it behooves states and drivers to come together to reduce the number of lives lost.
Whether it’s fender-benders or T-bone accidents, if you were involved in an accident, it’s time to turn to the experts. Get the support you need when holding others to account and win the justice you deserve by contacting DJC Law for your free consultation today.
Frequently Asked Questions About Car Accident Statistics
How many car accidents happen every year in the U.S.?
The latest data illustrates that there are around six million car accidents every year, with roughly 40,000 fatalities. The COVID-19 pandemic saw constant increases in fatal accidents, but in the post-COVID era, numbers are gradually coming down as technology and public safety campaigns start to drive progress.
Which types of vehicles are involved in the most fatal crashes?
The deadliest vehicles are passenger cars, as they’re the most common vehicle type in fatal accidents, as they make up the majority of vehicles on the road. However, SUVs and pickup trucks have seen double-digit surges in fatal accident rates over the past ten years.
What is the leading cause of car accidents in the U.S.?
Human error makes up 90% of all accidents, with speeding, driving under the influence, and distracted driving being the leading causes of all car accidents. It’s hoped that technological advancements like self-driving vehicles could help to cut accidents by addressing the human error factor in the years to come.